If you built your web application with VS .NET, you can test and debug it right inside the development environment. In edit mode press the F5 key to start your application in debug mode and press Ctrl+F5 if you don't want to use the debugger. The current page will be displayed within the standard browser.
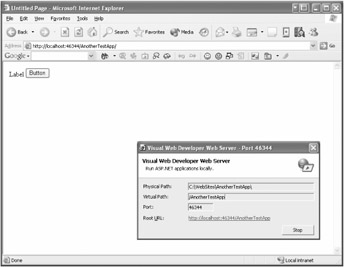
Any application stored at the local IIS level will be used as server. Whenever you save a project in the local file system, the integrated web server, which looks somewhat like the familiar Cassini server, will be started. The final VS .NET release will likely offer you the choice to select one or both directly.
| Tip |
So far, web projects in VS .NET aren't compiled explicitly but implicitly. The main benefit of implicit compilation is that it's possible to have a browser window open in parallel to the VS .NET window.You can edit the code, save it, and then just refresh your browser window. As I said, no explicit compilation is required—that makes development a lot easier, doesn't it? |
Please note that any page of the project, including dependent files, will be compiled at the first request dynamically (see Figure 2-14). Failures may be detected by calling each page. Another method is to compile the whole application at once by using this URL: http://<Host>:<Port>/<App>/precompile.axd. I cover precompilation further later on in the chapter.
Comfortable debugging doesn't depend on the chosen server. As usual, pressing F9 or clicking the gray area next to the row number will set or delete a breakpoint. Pressing Ctrl+Shift+F9 will remove all breakpoints at once after confirmation. Additionally, the following functions are available:
F10: Step over
F11: Step into
Ctrl+F10: Run to cursor
| Tip |
When you start a project by pressing F5, the IDE generates a web.config file automatically after a confirmation if one doesn't already exist. This web.config file will contain the known compilation tag. |
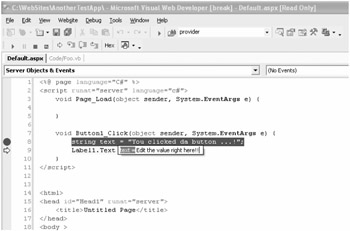
Debugging in VS .NET is quite smart and intuitive. Regardless of whether the code lives in the source code file or in the ASPX file, the compiler will jump to the right position. Another nice feature is the option to change the value of a variable right in the tool tip while debugging, as shown in Figure 2-15.
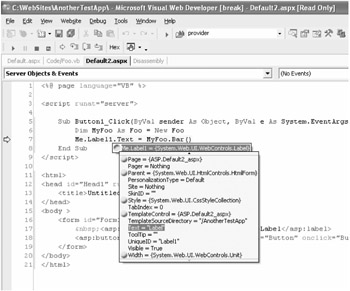
Now I'd like to introduce the Object Inspector in VB .NET to you (see Figure 2-16). An enhanced tool tip shows all properties of an object, and you can open the subobjects step by step. Stop dreaming: Changing the source code at run time as you can in client applications still doesn't work in web applications. But it is possible (in all languages) to edit the source code while you're debugging. The changes will take effect on the next request or postback.