At the outset, the basic dimensioning and installation of a multiple-user platform on Windows Server 2003 differs little from other server scenarios in the Microsoft BackOffice environment. (See Chapter 1 and Chapter 2.) However, adjusting the hardware capacity relies heavily on the number and type of applications on the terminal server. The users, who can be grouped into different categories, are important as well. A user’s working profile ranges from simple data input using just one application to simultaneous use of several resource-intensive applications.
The following questions need to be answered at this point: What is the maximum number of users that a server can handle? How many applications can be installed per server? How can applications and users best be distributed over several servers?
To find the answers, unfortunately, requires an in-depth investigation into the available server resources, user categories, and preferred applications. Ideally, we would have a table with the number of potential users in one column and the matching server configuration right next to it. However, individual user requirements and application characteristics are so different that it is impossible to create a table without setting fixed framework parameters.
| Tip |
Every calculation model for server dimensions in multiuser environments is based on ideal assumptions. Previous experience with terminal server projects has taught us that there is no universally applicable formula to calculate the resources needed. For this reason, the calculation models produce rough estimates only, with ample wiggle room. It will never be possible to accurately predict to the megahertz (MHz) or the megabyte (MB) the necessary clock speed and main memory requirement—except for ideal environments. |
Before we can define users per server, applications per server, or applications per user, we need to categorize the specific parameters.
| Note |
This is precisely where we encounter one very sticky issue in preparing this book: Who exactly is the target group? Am I addressing managers, administrators, consultants, and system integrators who are planning to set up terminal server environments for 10, 100, 1000, or 10,000 users? Are we talking about 2, 10, 100, or 500 servers? Do we mean 2, 10, or 100 applications? To define each category would not be practical for environments with 10 or 20 potential terminal server users and a handful of applications. However, if more than 500 users need dozens of central applications, we cannot get around attempting an estimate. For large projects, you can, of course, “feel your way” toward the goal by buying servers until everything fits. However, this means planning has a high degree of uncertainty, which is unacceptable for most projects. My own project experience (including up to 140 applications for 5500 users) shows that thorough planning is needed to set environments with more than five servers if you want to avoid problems with administrators, users, and management. In Chapter 11, you will find additional information on using terminal servers in medium-sized and large companies. |
How do we categorize the users in the multiple-user environment? This question has prompted much controversy since the introduction of terminal servers. Three key user categories emerge, shown in the following table. However, they are fully out of context without application and server categories. We will use these categories in this book; yet keep in mind that they do not entirely match the “classic” definitions, which have proven inadequate in the past.
Naturally, these categories do not fully describe all users. In many user groups, not all users work simultaneously or continuously with the computer system. Overall, this means that many more users can work with the system than planned. The distinguishing feature is the typical length of time the application is in use, which differentiates the part-time user from the full-time user. On average, a significantly higher number of part-time users can work with the system than pure full-time users. On the other hand, the behavior of part-time users is a lot less predictable than that of full-time users. All the part-time users could want to work with a certain application at the same time, at month’s end, for instance. In this case, they behave like full-time users. The terminal server environment should not reach its point of saturation precisely at that time, of course.
Many approaches to server dimensioning assume three categories of applications: 32-bit, 16-bit, and DOS applications. But the reality is different. For one thing, almost no DOS applications run on terminal servers anymore. Furthermore, typical 32-bit applications behave very differently from one another. An average user working with PowerPoint puts substantially more load on a terminal server than the average Word user, mainly because PowerPoint produces much more graphical output, which the RDP protocol caching mechanism cannot support. Word, however, is used primarily to enter character strings, which can be easily optimized through the Glyph cache. The categories of applications listed in this table are a far better real- world representation.
|
Application Category |
Description |
|---|---|
|
Application with low requirements |
Application with relatively low processor, memory, and graphics-output requirements. Uses no other components or processes, only text. Typical applications in this category are WinZip (moderate use) or text-based terminal emulation. |
|
Application with medium requirements |
Application with normal processor, memory, and graphics-output requirements. Uses additional components for specific tasks (for instance, COM components or assemblies) and sometimes accesses back-end network resources. Typical applications in this category are Microsoft Word (excluding macros), Microsoft Excel (excluding macros), Outlook, Internet Explorer (excluding ActiveX), Adobe Acrobat Reader, or simple database clients. |
|
Application with high requirements |
Application with high processor, memory, and graphics-output requirements. Uses additional components and accesses back- end network resources. Typical applications in this category include PowerPoint, graphics programs, development environments, modern ERP clients (for example, SAPGUI), or sophisticated database clients. |
A more precise differentiation requires calculating a base value for resources used by each application at and just after startup. This base value includes the time span and processor load for the first instance of the application and for each additional instance—before any user interaction whatsoever. This initial estimate says a lot about what will happen if numerous users try to work with an application at the same time, such as at the beginning of the workday. At the very least, memory is later occupied even if a user is no longer working with the application.
The second key parameter is the additional processor and memory resources used when users are working with the particular application. This value depends on the user data that the application loads. For Word or PowerPoint, exceptional circumstances could generate additional data volume per user as high as 100 MB. The processor load also increases, but the higher load quickly dissipates in most applications.
| Note |
16-bit applications need approximately 30–50 percent more memory and processor power than comparable 32-bit applications because they use the Windows-on-Windows emulation layer. |
To obtain a realistic estimate of the memory needed in a terminal server environment, we need to examine the application set, that is, all the applications combined. This will tell us the required maximum memory if every user launched every available application. The first number indicates the memory required for the applications without loaded user data only. The second calculation includes the loaded user data. Although both values are more or less theoretical, they do reveal both ends of the spectrum. It can never get any worse!
If you want similar values for processor and network load, you need to invest in extensive load testing, which is discussed in detail in Chapter 11. However, these tests are not as important for determining the required server resources as the memory requirements.
| Tip |
DOS applications should definitely be avoided on production terminal servers. Because they use the emulation layer to execute and make (possibly) permanent keyboard requests, DOS applications put a much heavier load on terminal servers than comparable Windows-based applications. If a company needs DOS applications, they should be provided on a separate terminal server especially set up for this purpose. |
Servers used in standard terminal server environments have the following subcomponents:
Computer power Between one and eight processors (CPUs) with clock speeds above one GHz.
Working memory Main memory expansion between 500 MB and above four GB.
Hard drive system Powerful hard drives (SCSI or E-IDE) providing between 20 to 100 GB, usually set up in a RAID-1 group (mirroring) for reliability reasons.
Network At least one network card (NIC) with transfer speeds between 100 megabits per second (Mbps) and 1 gigabit per second (gigabit/s).
Table 5.3 organizes the diverse server configurations into more or less four categories. Only the low-end server has an individual network card, which is used to communicate with clients and back-end servers. All other server categories have two network cards.
|
Server Category |
Number of CPUs |
Clock Speed |
Main Memory |
Hard Drives |
NIC 1: To the Clients |
NIC 2: To the Back End |
|---|---|---|---|---|---|---|
|
Low-end server |
1 |
1,4 GHz |
1 GB |
2 x 18 GB |
100 Mbps |
-- |
|
Standard server |
2 |
1,4 GHz |
2 GB |
2 x 36 GB |
100 Mbps |
100 Mbps |
|
Enterprise Server |
4 |
1,4 GHz |
4 GB |
2 x 72 GB |
100 Mbps |
1 gigabit/s |
|
Datacenter Server |
8 |
1,4 GHz |
8 GB |
2 x 72 GB |
1 gigabit/s |
1 gigabit/s |
Unfortunately, servers do not scale linearly as processors and main memory are added. Tests show that doubling the processors does not double overall capacity. This is valid for all types of processors that function with terminal servers. The rule of thumb is that increasing the number of processors from one to two raises capacity by 50–60 percent. Increasing the number of processors from two to four adds another 40–50 percent.
The overall performance of the selected processor configuration depends on two other factors: clock speed and second-level cache. The second-level cache is a memory space located directly on the processor. By caching, it eliminates slow main- memory accesses. The larger the cache, the lower the number of memory accesses needed. Doubling the second-level cache increases capacity by about 10 percent.
What about main memory? Settings (for example, /PAE switch in the Boot.ini start configuration file) were already offered in Windows 2000 to enable access to over 4 GB of memory. Yet terminal servers with four or more processors often exhibited saturation behavior after occupying just over 2 GB of physical memory. This was not a problem of direct access to available main memory; the limits were the result of system-internal memory management. Related factors were the available free page table entries in memory and the limited size of the registry database containing system and user configuration data. If any of these factors pushed the terminal server environment to its resource limit, the whole system became unusable, so adding processors and physical memory made little sense. Therefore, rarely were terminal server environments configured for more than 200 simultaneous users. This is why limits on memory management had the greatest impact on the overall performance of systems utilizing large server platforms.
Windows Server 2003 either did away with such memory restrictions or increased the range substantially, making it highly unlikely that the free page table entries would restrict access to memory. The potential size of the registry database in main memory was also increased; the registry is now considered a file copy in memory (memory-mapped file). Nonetheless, initial tests on large server platforms still demonstrated limits in managing large numbers of simultaneous user sessions. Improvements to the operating system kernel, however, did double the number of user sessions that can be managed with Terminal Services under Windows Server 2003 compared to Windows 2000 Server.
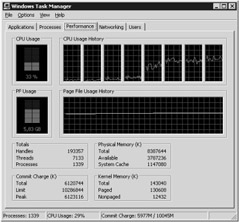
In Figure 5-9, each user has one document open in each of three applications (Notepad, Word, and Adobe Acrobat Reader), requiring approximately 60 MB per user session. The sharing of components saves about 2 GB of the total 8 GB required. It is very clear that more than 4 GB of physical memory was in use (total physical memory—available physical memory 4.5 GB). Users were not interacting with the applications at the time the data was captured; the applications are simply occupying memory. System-internal administrative tasks thus accounted for the full processor load! System reaction time to user actions in this scenario dropped noticeably from the time previously measured (dialog and window changes > 10 seconds).
Remember that the values obtained in these tests can differ widely in either direction depending on the application mix and the physical server platform. For accurate results, tests should be performed under actual conditions using the intended target platform. Because large servers tend to use resources poorly, however, the trend has been toward smaller server platforms using a maximum of four processors and 4 GB of main memory. This trend is supported by two newer technologies that might prove useful in terminal server environments.
Blade servers Server boards with one to four processors that can be inserted vertically in 19-inch racks housed in special cabinets. Because the boards are so small, a 19-inch rack can accommodate many servers.
Server virtualization Installing virtualization software on a guest system enables you to operate several virtual servers on one physical hardware platform. The virtual servers use predefined guest system resources. Typical examples of this software include Microsoft VirtualPC (formerly Connectix VirtualPC) or VMware by VMware, Inc.
These two technology trends might result in more farms with numerous smaller individual servers (physical or virtual). These scalability limits hampered most past terminal server projects from deploying large servers with more than four processors. In the future, a typical individual server on a terminal server farm will likely fall into the Standard Server or Enterprise Server category, as described in Table 5.3.
In further support, we also know that doubling the number of server processors usually more than doubles the price of the hardware platform. For large servers, the only potential savings lie in the price of the operating system license and automated installation of the terminal server environment. Even so, these issues will probably be resolved in the near future as well. Microsoft is already developing a licensing model that reflects the number of processors, and a number of manufacturers are offering powerful tools for mass installation.
The bottom line is that one-processor systems are generally too small and eight-processor systems are too large for use in terminal server environments. Naturally, there are always exceptions if special requirements or conditions apply.
| Note |
A consistent 64-bit architecture can solve many scaling problems caused by the addressable main memory. Unfortunately, few user applications are available in 64-bit versions. If 32-bit applications are run on the 64-bit version of Windows Server 2003, memory accesses and system requests need to be channeled through an emulation layer. As mentioned previously, this technology already allows 16-bit applications to run on the 32-bit variants of Windows NT, Windows 2000, and Windows Server 2003. Unfortunately, the emulation layer consumes substantial system resources to access memory and convert system requests from 32 to 64 bits, essentially canceling out the potential advantages of 64-bit applications. |
What are the dependencies between the categories? Only by viewing them in a relatively simple context can we make concrete estimates of resource requirements.
First, consider the impact of the minimum requirements of a certain user category on memory size. The resulting value is derived from the observation that user applications initially use 2–8 MB of main memory after startup.
Add to the values shown in Table 5.4 the 10 MB of memory for each user session on a terminal server (excluding applications). Ten MB is the total needed by Csrss.exe (approx. 2.5 MB), Ctfmon.exe (approx. 2 MB), Rdpclip.exe (approx. 2.3 MB), and Winlogon.exe (approx. 3 MB).
|
User Category |
Minimum Main Memory Requirements |
|---|---|
|
Users with low requirements (Light User) |
A light user starts one to three applications and prefers using only one. Therefore, the minimum amount of memory that applications need is approximately 10 MB per user. |
|
Users with medium requirements (Medium User) |
A medium user launches two to six applications and uses them alternately. Therefore, the minimum amount of memory that applications need is approximately 20 MB per user. |
|
Users with high requirements (Heavy User) |
The heavy user launches more than five applications and sometimes uses them simultaneously (for example, opening several large documents). Therefore, the minimum amount of memory that applications need is approximately 30 MB per user. |
| Note |
Ctfmon.exe supports speech recognition, handwriting recognition, keyboard adjustments, and other alternative input technologies. Rdpclip.exe allows you to copy and paste files between a terminal server and a Terminal Services client. |
The result is the following formula:
Memory requirement = Number of light users x (10 MB + 10 MB)
+ Number of medium users x (20 MB + 10 MB)
+ Number of heavy users x (30 MB + 10 MB)
To further refine the main memory requirements, we need to classify users not only by category, but also by the applications they use the most. Use the following matrix to help you with this additional estimate. In the calculations in this table, x users of a group need y MB main memory for their applications. A category- dependent percentage is added to the applications’ memory requirement. This percentage covers the use of additional system resources.
|
Application Category User Category |
Applications with Low Requirements (+ 0%) |
Applications with Medium Requirements (+ 10%) |
Applications with High Requirements (+ 20%) |
|---|---|---|---|
|
Light User (+ 0%) |
X users (Y MB) |
X users (Y MB) |
X users (Y MB) |
|
Medium User (+ 10%) |
X users (Y MB) |
X users (Y MB) |
X users (Y MB) |
|
Heavy User (+ 20%) |
X users (Y MB) |
X users (Y MB) |
X users (Y MB) |
|
Total |
Result A |
Result B |
Result C |
In Table 5-5, the application sets of a specific application category are allocated to user categories. The number of users and memory required are totaled per application category. Additional memory is required based on the application and user categories. This added percentage takes into account the average memory needed for additional components (COM components, assembly DLLs, clipboard, and so on). Depending on the environment, it might be necessary to adjust this percentage.
Before this table can be completed we need to know how much memory each application initially needs after start-up and the average memory required once user- specific documents are loaded. The first value represents the basic memory requirement after application start and the second includes the loaded user data.
Finally, the memory requirement is compared to the result in Table 5.6. This is based on the typical processing power needed for certain user categories. We assumed a clock speed of 1.4 GHz and a second-level cache of 256 KB.
|
Server Category |
Low-End Server |
Standard Server |
Enterprise Server |
Datacenter Server |
|---|---|---|---|---|
|
Typical number of light users |
50 |
80 |
150 |
200 |
|
Typical number of medium users |
30 |
45 |
90 |
110 |
|
Typical number of heavy users |
15 |
25 |
50 |
65 |
Doubling the processors’ clock speed increases computing power by 25 percent; halving it decreases it by 25 percent. Doubling the second-level cache boosts computing power by 10 percent.
The four results of the different calculations are likely to vary. Nevertheless, they represent the range for which resources should be planned. The actual range will fall somewhere between the high and low end.
| Note |
These resource estimates are only preliminary, of course. Production environments do fluctuate from previous estimates. More accurate planning requires the load tests described in Chapter 11. Always bear in mind that accurate planning for large terminal server environments requires substantial time and attention. |
Let us move from the theory of user, application, and server categories and apply what we have learned to a concrete sample. The following fictional company produces and sells software products. It has 700 employees and plans to centralize some of its most frequently used applications on terminal servers. Employees are grouped as follows:
Development, 100 employees: This division includes developers, product managers, quality assurance staff, test engineers, and technical writers. To keep it simple, we will also include administrators of internal computer systems and the network in this group. Compilers, special testing tools, and network monitoring products will remain on the local platforms. Employees in this group thus fall into the medium-user category.
Support, 150 employees: Three shifts provide telephone and e-mail support, thus we need to include only 50 simultaneous user sessions in our calculation. The support task requires only a few applications, making these employees light users.
Sales, 150 employees: This department comprises sales staff and sales assistants. They use a customer relationship management system and e-mail several times a day. This group is made up of medium users.
System engineers, 200 employees: These employees install and configure the company’s products at the various customer sites, where they use Internet or dial-up connections to access the terminal servers to generate project reports and view product documentation. Usually, only about half of them are logged on interactively, which equates to 100 simultaneous user sessions. The members of this group are medium users.
Marketing, 50 employees: This division includes all employees who create marketing material and articles for publication. These tasks require different applications that frequently include high-resolution graphical elements, putting this group into the heavy-user category.
Administration, 50 employees: Besides accounting, project coordination, and human resources, this group also includes company management. With a few exceptions, the members of this group are all medium users.
The preceding information is enough to allow us to make an initial rough estimate of the required resources. Seven hundred employees will need 500 simultaneous user sessions. We omitted vacation and sick leave from our calculation because it occurs irregularly, providing us with a bit of a buffer. The user categories are as follows:
Fifty light users: support staff
Four hundred medium users: staff in development, sales, and administration, plus the systems engineers
Fifty heavy users: marketing staff
First let’s calculate the base values for main memory and processor requirements:
Memory requirement = 50 x 20 MB + 400 x 30 MB + 50 x 40 MB
= 1,000 MB + 12,000 MB + 2,000 MB
= 15,000 MB
= 15 GB
Now let’s do the server calculation. First we need to determine the preferred hardware platform. For this example, let us assume that the terminal servers are installed on blade servers with two processors each. The processors have a clock speed of 1 GHz and a 256 MB second-level cache. One blade server thus corresponds to a standard server with approximately 10–15 percent less output due to the low processor clock speed, as in the reference model in Table 5.6. The basis for our calculation is as follows:
Light users per blade server: 80 users – 10% = 70 users
Medium users per blade server: 45 users – 10% = 40 users
Heavy users per blade server: 25 users – 10% = 22 users
We now calculate the number of blade servers required:
Number of servers = 50 light users/70 users per server
+ 400 medium users/40 users per server
+ 50 heavy users/22 users per server
= 0.7 + 10 + 2.3 servers
= 13 servers
The initial result indicates that we need about 13 servers and at least 15 GB of main memory for the applications. Each server needs an additional 256 MB of main memory for the operating system. Therefore, the total requirement is 18.25 GB minimum. If we use blade servers with 2 GB of main memory each, the dimensioning should approximate the requirements.
To compare the initial calculation to the maximum, we need a list of the applications actually used. The memory required stated is an average value if several instances are invoked. If the overall conditions change, actual memory requirements might deviate significantly from the values provided.
| Note |
If you use different file editors in Outlook (such as Word to write e- mail messages), the initial memory per instance of Outlook might reach 60 MB. You need to adjust the calculation shown in Table 5.7 accordingly.
|
We can now figure the maximum application memory required per user category. We will assume that each user authorized to use the application has, in fact, started it.
This example shows the estimate for Outlook 2000 without user-specific documents:
If we do the calculation as shown in Table 5.8 for all applications of the fictional company, the result is approximately 28 GB without user-specific documents and 42 GB with them. The latter is the absolute maximum and reflects real resource requirements only under exceptional circumstances.
|
Application User Category |
Outlook 2000 (+ 10%) |
|---|---|
|
Light User (+ 0%) |
Support: (50 x 7 MB) + (0% + 10%) |
|
Medium User (+ 10%) |
Development: (100 x 7 MB) + (10% + 10%) Sales: (150 x 7 MB) + (10% + 10%) System eng.: (100 x 7 MB) + (10% + 10%) Administration: (50 x 7 MB) + (10% + 10%) |
|
Heavy User (+ 20%) |
Marketing: (50 x 7 MB) + (20% + 10%) |
|
Total |
Result: 4200 MB |
| Note |
The CD included with this book contains a file with the full calculation of the memory requirements for the fictional company’s applications. You can also use the file as a template for your own calculations. |
The estimated minimum resources needed for the company’s application and user mix indicates that 13 blade servers and 18.25 GB of main memory are required. Each of the blade servers provisioned can have 2 GB of main memory, 256 MB of which are needed for the operating system. Therefore, 13 x 1.75 GB = 22.75 GB are available for applications and user sessions. This even suffices if every user simultaneously started all the applications they are authorized to use. Using the 42 GB as a base maximum for applications and adding 10 MB for each user session, we arrive at approximately 27 blade servers. The calculation:
42 GB + (500 x 10 MB) = 42 GB + 5 GB = 47 GB
47 GB / 1,75 GB pro Server = 26,85 Server
The result indicates that 13 to 27 blade servers are required. The latter number is certainly impressive: 27 servers for 500 users! This equals fewer than 20 users per server. This extreme applies only to companies that want to protect their investment by ensuring that their terminal server environment never reaches its saturation point. Fifteen to twenty blade servers are adequate for most companies because the likelihood of every user starting every application is virtually nil. This number also includes migration to newer versions of applications (such as upgrading Office 2000 to Office XP).
Finally, let us examine the required network bandwidth. On average, terminal server access by one user requires a minimum of 20 kilobits per second (Kbps). In the best case, each user has 50 Kbps. With 500 users, this would result in a bandwidth requirement of approximately 25 Mbps in the direction of the Terminal Services clients. This should not be a problem for the servers as long as the network infrastructure is powerful enough. Only file server access can significantly increase bandwidth requirements. It should therefore be calculated separately.
| Note |
This method of calculation was the result of much heated debate among experienced terminal server specialists. At some points, it contradicts the general school of thought expressed in many white papers. However, the methodology was validated in major real-life projects and is probably a very realistic approach to server dimensioning. |
The calculation methods introduced here do not apply if a terminal server farm is supplying many applications to numerous users. In this instance, many other statistical methods and techniques for user modeling are needed than are covered in the previous relatively simple example. A discussion of this topic, however, is beyond the scope of this book. The financial and organizational effort to support a very complex model also bears little relation to the results. It is often more cost- effective to buy too many servers than to finance a sophisticated model. Therefore, these types of environments usually favor a multiphase model. In the first phase, the resources needed are roughly calculated using a method similar to the one described above. In the second phase, test users from all the target groups work on a test system that provides the basic number of required applications. This provides an initial estimate of resource needs per user. In subsequent steps, the number of users is incrementally increased as the terminal server environment expands. In this way, calculation errors can be quickly identified and eliminated. Even so, the fact that we do not know the amount of resources actually needed in the end is problematic. It might also be necessary to distribute server purchases over several phases. You can find additional information on calculating costs and planning terminal server projects in Chapter 15.
Alternatively, you can also perform automated tests to identify the required hardware resources. These tests do take different user categories into account, although they tend to be very inflexible. Nevertheless, they can provide an initial estimate even if the analysis and modeling of concrete user groups is very complex. You can find more detailed information about terminal-server load testing and related tools in Chapter 11.